Joseph H. Tien
I have been fortunate to be part of an interdisciplinary team providing modeling support regarding COVID-19 dynamics in Ohio.
These efforts began in early March when Grzegorz Rempala, professor in the College of Public Health’s Division of Biostatistics, and I organized a meeting between medical doctors, epidemiologists, modelers and local health organizations regarding COVID-19 response. This initiated a partnership with the Ohio Department of Health (ODH) and the Ohio Hospital Association (OHA) on predictive modeling for COVID-19.
I will focus here on our initial efforts to predict hospital resource needs for COVID-19 patients. While I will primarily discuss the mathematical aspects of the project, this has very much been an interdisciplinary effort, with core faculty coming from Biostatistics (Eben Kenah, Grzegorz Rempala), the Wexner Medical Center (Courtney Hebert, Christina Liscynesky), the Department of Geography and the Division of Epidemiology (Elisabeth Root), and Environmental Health (Mark Weir).
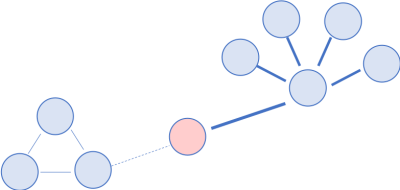
The mathematical approach begins with a stochastic disease process on a graph, where the nodes correspond to individuals and the edges correspond to interactions with the potential to transmit disease. Nodes are categorized according to their immunological status (susceptible, infectious, recovered). The network is also dynamic, as edges can deactivate over time. The stochastic process is Markovian, with rate parameters for disease transmission, recovery and edge deactivation, together with two parameters describing network structure. Jacobsen et al [1] proved that as the network size increases, this stochastic process converges to a system of ordinary differential equations. This differential equation serves as the base of our model. It is a simple model, in that it has only a handful of parameters and is easy to solve numerically (no large-scale simulations needed). The model does, however, incorporate variation in contact between individuals, and also allows for variation in contact over time in response to infection.

Schematic of the model showing disease spread on a dynamic network

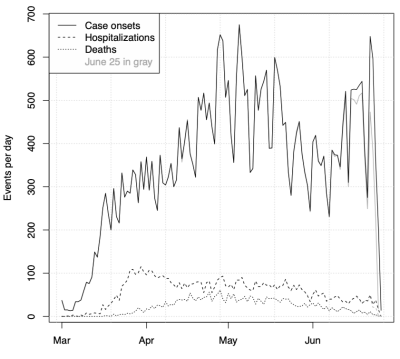
Data plot showing case onsets, hospitalizations and deaths over time for Ohio.
We calibrate the model using onset time data for identified COVID-19 cases in Ohio. The estimation approach involves considering the differential equation model from the viewpoint of survival analysis in KhudaBukhsh et al [2]. There are many challenges with COVID-19 data, including limited test volume, changes in testing protocol over time, undetected infections and delays between test administration and reporting. While challenges remain, our estimation method is well-suited to partial observation of cases and is a statistically principled approach allowing for uncertainty quantification.
I would like to highlight that the work described above has been built upon research conducted by postdoctoral fellows at the Mathematical Biosciences Institute. MBI postdoc Karly Jacobsen (with M. Burch, J. Tien, and G. Rempala) proved the law of large numbers giving the underlying network model, and MBI postdoc Wasiur KhudaBukhsh both helped develop the estimation approach (with B. Choi, E. Kenah, and G. Rempala) and carried out the bulk of the estimation in our COVID-19 modeling work with ODH and OHA.
I will also add that graduate students and undergraduate alumni of the Department of Mathematics have contributed significantly to the modeling efforts. For example, PhD student Esteban Bernal assisted with translating statewide COVID-19 cases to hospital census counts over time. Two alumni of our undergraduate program are also assisting in the fight against COVID-19: biostatistics assistant professor Patrick Schnell has developed a discrete-time version of the above model that can flexibly handle change points for the model parameters, and Yibo Shao is an advisor at ODH. Both Patrick and Yibo participated in the Research for Undergraduates: Adventures in Mathematical Biology and its Applications program while at Ohio State.
The timescale over which this work was done was extremely short, reflecting the urgent need for modeling input to be considered by ODH, OHA and Gov. Mike DeWine in their decision-making. Initially, a rapid rise in COVID-19 cases was observed, and model output correspondingly predicted a large outbreak with epidemic peak approaching 10,000 daily cases. However, a sudden shift in the case curve was observed around March 17, and our model predictions correspondingly dropped. This break in the case curve almost certainly reflects social distancing. A further, nontechnical description of this can be found in our blog post. Subsequently, cases remained nearly level for months. This is not typical behavior for an epidemic.
We are still in the early stages of understanding COVID-19. It has been intense, stressful, but also rewarding to apply mathematics to help these efforts. We look forward to continuing these interdisciplinary efforts going forward.
[1] K. A. Jacobsen, M. G. Burch, J. H. Tien, and G. A. Rempala. The large graph limit of a stochastic epidemic model on a dynamic multilayer network. Journal of Biological Dynamics, 12(1):746–788, 2018.
[2] W. R. KhudaBukhsh, B. Choi, E. Kenah, and G. A. Rempala. Survival dynamical systems: individual-level survival analysis from population-level epidemic models. Interface Focus, 10(1):20190048, 2020.
