Dustin G. Mixon
The year 2020 will be remembered for its historic confluence of the COVID-19 pandemic, the George Floyd protests and the presidential election. As if that weren't enough, here's another way 2020 will have a lasting impact on our country: The 2020 census and state legislative elections will determine how voting districts are drawn across the country for the next decade. Indeed, by the "one person, one vote" principle, every voting district in each state must contain the same sized population (as measured by the census). In 2021, each state legislature will draw maps for state and federal voting districts that satisfy this census-based constraint. The maps must be drawn in time for the midterm elections in 2022, meaning 2021 is redistricting season.
The intent of a representative democracy is to have the people select their representatives. The redistricting process flips this intent on its head, since in effect, representatives select the people they want to represent. This opens the door for gerrymandering, which is the manipulation of voting district boundaries to favor a certain party or class. Depending on the state's redistricting protocol, several types of gerrymandering are possible. In many states, the party in power has the ability to draw maps that favor that party. The following illustrates how this is possible (cropped from [7]):
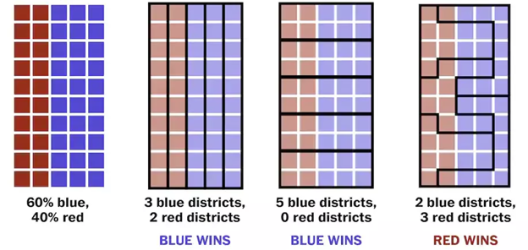
This is known as partisan gerrymandering. Racial gerrymandering is when a map is drawn to favor one race over another. Note that even a bipartisan approach to redistricting can produce gerrymandered results, since one could draw a map to favor certain incumbents from both parties.
On its face, gerrymandering poses an existential threat to representative democracy. Perhaps surprisingly, mathematical analysis has played a key role in combating this threat from several directions.
Combating gerrymandering in public opinion
If the public doesn't approve of certain behaviors, then elected representatives will hopefully avoid those behaviors. As such, one way to combat gerrymandering is to simply spread the word that gerrymandering exists. In this spirit, we periodically find certain voting districts being lambasted by the news media [4],[6]:
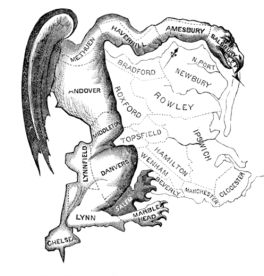
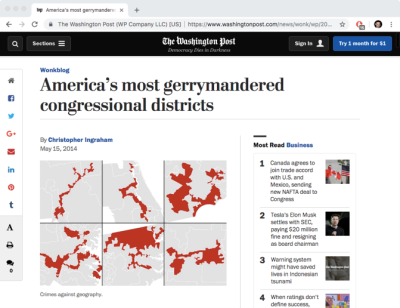
In fact, this is precisely how the word "gerrymander" was coined. In 1812, Gov. Elbridge Gerry approved a redistricting plan for Massachusetts that benefited his party. In response the Boston Gazette published the above political cartoon, which likens one of the districts to the profile of a salamander. Hence, “gerrymander.”
These representations in media give the impression that (1) strangely shaped districts are necessarily gerrymandered, and conversely, (2) gerrymandered districts necessarily have strange shapes. Sadly, these impressions are wrong. First, depending on how the population is distributed, strange shapes are sometimes required to ensure folks are adequately represented. Consider the task of distributing the following 576 people into five districts:

Notice that the 576 people are arranged in 3-by-3 blocks, each block consisting of 5 blue and 4 red. This means blue has a slight majority, and this majority is well distributed across the state. Thanks to this homogeneity, it turns out that any nicely shaped district of the appropriate size will necessarily inherit this majority-blue feature. As such, to obtain a more equitable result, one must draw strange-looking districts. This conflict between district shape and fairness is the subject of a so-called "impossibility theorem for gerrymandering" [1].
It's also possible to gerrymander with nicely shaped districts. For example, using the 2016 presidential election results as a proxy for party affiliation, one can use straight lines to optimally gerrymander Wisconsin for either party:
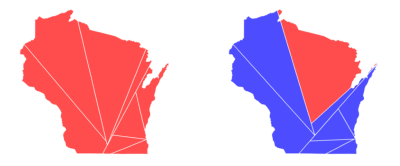
(Note that it's impossible to secure all 8 seats for the Democrats in this case since Donald Trump carried Wisconsin in 2016.) Under a certain model, one can gerrymander with straight lines to win over 70% of the seats despite getting only half of the vote [2].
There have been several outreach events to bring these issues to the public's attention. For instance, see my contribution to Ohio State's Science Sundays lecture series [10]. Notably, a team of Boston-based mathematicians known as the Metric Geometry and Gerrymandering Group hosted a sequence of Geometry of Redistricting workshops across the country, and they continue to offer additional resources on their website [9].
Combating gerrymandering in the courts
Of course, public pressure is insufficient to completely deter bad behavior. As a complementary measure, folks have taken various maps to court. In order to obtain evidence that a given map is a gerrymander, it has become popular to collect statistics from the set of compliant maps. Here, we say that a map is compliant if it satisfies various constraints, such as geographic compactness, compliance with the Voting Rights Act, and one person, one vote. Suppose a statewide election results in a landslide victory for a party that won only a small fraction of the vote. Then one can consider the same election with a map that is drawn at random from the set of compliant maps. Here, the precinct-level votes are held fixed, while the precincts are redistributed according to a randomly drawn compliant map. If the vast majority of compliant maps fail to reproduce such a landslide victory, then the map might be a partisan gerrymander. One could use similar statistics to argue whether a map is a racial gerrymander.
But how should one select a random sample from the set of compliant maps? It isn't practical to enumerate the large number of compliant maps, so this requires some amount of cleverness. A well-known approach is to apply Markov chain Monte Carlo methods, which were used by Herschlag et al. [5] to demonstrate partisan gerrymandering in North Carolina for Rucho v. Common Cause. The following plot illustrates simulated election results in each of North Carolina's 13 congressional districts using different maps and voting data. Specifically, they consider the maps (NC2012 and NC2016) that were drawn for the 2012 and 2016 elections, a map (Judges) developed by a bipartisan group of retired judges as part of the so-called "Beyond Gerrymandering" project, as well as randomly drawn maps (illustrated by box plots). The precinct-level voting data comes from the 2012 and 2016 U.S. congressional races (USH12 and USH16), the 2012 presidential race (PRE12) and the 2016 US senatorial race (USS16).
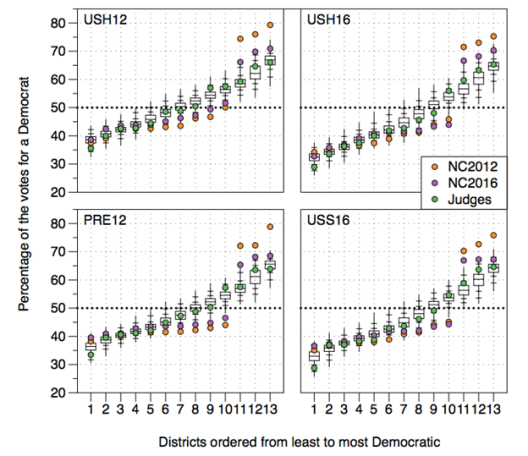
Strikingly, the map developed by retired judges behaves similarly to randomly drawn maps, while Democrats consistently carry fewer seats in both maps drawn by North Carolina's Republican-led General Assembly.
One potential weakness of the Markov chain Monte Carlo approach is that the mixing time of the underlying Markov chain is unknown, so the resulting random samples might not be drawn according to the desired stationary distribution. This can be remedied by applying a test recently devised by Chikina, Frieze and Pegden [3]. Intuitively, you might suspect that a map is gerrymandered if the vast majority of nearby compliant maps produce a more equitable election result. To make this intuition rigorous, suppose someone presented you with a state s from a Markov chain and claimed that s was drawn from the Markov chain's stationary distribution. Then we can take a random walk initialized at s for any number of steps, and if s is an extreme outlier of this walk, it turns out we can reject the claim with a correspondingly small p-value. For example, Pennsylvania's 2011 congressional map happens to be an outlier in this sense [12]:
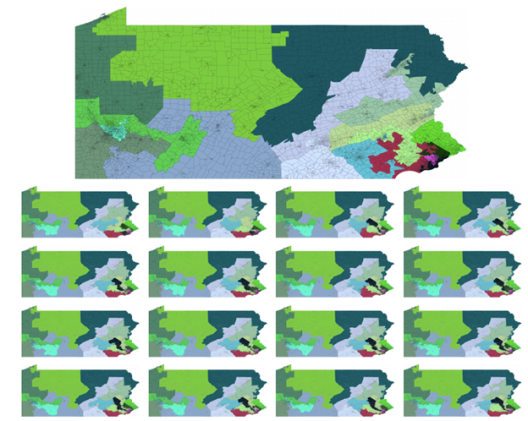
In fact, all of the (slight!) perturbations of the congressional map above produce vastly more equitable election results. This evidence compelled the Pennsylvania Supreme Court to throw out the map in its League of Women Voters of Pennsylvania v. the Commonwealth of Pennsylvania ruling.
Combating gerrymandering in the redistricting protocol
In the aftermath of Gill v. Whitford, it appears the U.S. Supreme Court is not capable of defeating partisan gerrymandering. In response to this development, instead of pursuing methods to detect gerrymandering, it's become popular to identify preventative measures. For example, one might devise a redistricting game in which both players (i.e., both major political parties) attempt to play optimally as partisan agents, but in doing so, they inadvertently cooperate to draw an equitable map. In this spirit, two noteworthy games were recently developed.
The first game was inspired by the "I-Cut-You-Choose" solution to the cake-cutting problem: Give one child the task of cutting a cake in half, and allow the other child to select the half of her choosing. Then neither child has room to complain about the distribution of cake. Can we replicate this effect in the redistricting problem? Enter "I-Cut-You-Freeze," in which the first player draws a compliant map, the second player freezes one of the districts and redraws the remainder of the map, the first player freezes another of the districts and redraws the remainder of the map, etc. One can prove that when the number of districts is large, the resulting map is equitable [13]. Unfortunately, the first player enjoys a substantial advantage when the number of districts is small. (As an extreme example, observe that the first player serves as de facto mapmaker when there are only two districts.)
A second game, known as "Utility Ghost," avoids this problem of few districts. In this game, players take turns assigning precincts (or counties, census blocks, etc.) to voting districts. (When a player moves, they also demonstrate that the move is legal by providing a compliant map that is consistent with the current assignment of precincts.) One can prove that under optimal play, the resulting map is equitable, regardless of the number of districts [11]. As an example, consider New Hampshire:

We want to divide New Hampshire's 10 counties (depicted on the left) into two voting districts. Above, we illustrate all possible maps of two contiguous districts for which the difference in district populations is less than 10% of the entire population. District colors correspond to which party receives more votes (using the 2016 presidential election as a proxy). Six of the seven compliant maps produce an equitable result. Under the I-Cut-You-Freeze protocol, if Democrats play first, then the resulting map is not equitable. Meanwhile, the Utility Ghost protocol avoids this map regardless of who plays first.
In conclusion...
In this article, we discussed how mathematics has been used to combat gerrymandering in public opinion, in the courts and in the redistricting protocol. To have a lasting impact, states need to change the way they perform redistricting. Importantly, this is politically viable. For example, if the party in power fears a sea change on a looming census year, they'd be inclined to institute such a reform for their own sake. More concretely, in 2015 and 2018, Ohio voters overwhelmingly approved two constitutional amendments that reform the state's redistricting process [8]. For Ohio, this offers something that is much needed after a year like 2020: hope.
[1] B. Alexeev, D. G. Mixon, An impossibility theorem for gerrymandering, Amer. Math. Mo. 125 (2018) 878-884.
[2] B. Alexeev, D. G. Mixon, Partisan gerrymandering with geographically compact districts, J. Appl. Probab. 55 (2018) 1046-1059.
[3] M. Chikina, A. Frieze, W. Pegden, Assessing significance in a Markov chain without mixing, Proc. Natl. Acad. Sci. U.S.A. 114 (2017) 2860-2864.
[4] E. C. Griffith, The Rise and Development of the Gerrymander, Scott, Foresman, 1907.
[5] G. Herschlag, H. S. Kang, J. Luo, C. V. Graves, S. Bangia, R. Ravier, J. C. Mattingly, Quantifying Gerrymandering in North Carolina, https://sites.duke.edu/quantifyinggerrymandering/files/2019/10/SBR-format.pdf
[6] C. Ingraham, America's most gerrymandered congressional districts, The Washington Post, https://www.washingtonpost.com/news/wonk/wp/2014/05/15/americas-most-gerrymandered-congressional-districts/
[7] C. Ingraham, This is the best explanation of gerrymandering you will ever see, The Washington Post, https://www.washingtonpost.com/news/wonk/wp/2015/03/01/this-is-the-best-explanation-of-gerrymandering-you-will-ever-see/
[8] R. Ludlow, Check out the mechanics of how Ohio’s congressional, legislative redistricting will work, The Columbus Dispatch, https://www.dispatch.com/story/news/politics/elections/2020/11/03/ohio-new-congressional-legislative-lines-heres-how-redistricting-works-republicans-democrats-agree/6088922002/
[9] Metric Geometry and Gerrymandering Group, https://mggg.org/
[10] D. G. Mixon, The mathematics of partisan gerrymandering, ASC Science Sundays, https://www.youtube.com/watch?v=OwJEL72cNKw
[11] D. G. Mixon, S. Villar, Utility Ghost: Gamified redistricting with partisan symmetry, arXiv:1812.07377
[12] W. Pegden, Pennsylvania's Congressional districting is an outlier: Expert Report, https://www.brennancenter.org/sites/default/files/legal-work/LWV_v_PA_Expert_Report_WesleyPegden_11.17.17.pdf
[13] W. Pegden, A. D. Procaccia, D. Yu, A partisan districting protocol with provably nonpartisan outcomes, arXiv:1710.08781
